

| [Home|New job|Help] |
Results for minimum free energy prediction
The optimal secondary structure in dot-bracket notation with a minimum free energy of -435.50 kcal/mol is given below.
[color by base-pairing probability | color by positional entropy | no coloring]
You can download the minimum free energy (MFE) structure in [Vienna Format| Ct Format]. You can get thermodynamic details on this structure by submitting to our RNAeval web server.
Results for thermodynamic ensemble prediction
The free energy of the thermodynamic ensemble is -459.23 kcal/mol.
The frequency of the MFE structure in the ensemble is 0.00 %.
The ensemble diversity is 414.77.
You may look at the dot plot containing the base pair probabilities [EPS|PDF|IMAGE CONVERTER].
The centroid secondary structure in dot-bracket notation
with a minimum free energy of -344.87 kcal/mol is given below.
[color by base-pairing probability | color by positional entropy | no coloring]
You can download the minimum free energy (MFE) structure in [Vienna Format| Ct Format]. You can get thermodynamic details on this structure by submitting to our RNAeval web server.
Graphical output
You may look at the interactive drawing of the MFE structure below. If you do not see the interactive drawing and you are using Internet Explorer, please install the Adobe SVG plugin. A note on base-pairing probabilities: The structure below is colored by base-pairing probabilities. For unpaired regions the color denotes the probability of being unpaired.
| Image description | Download options |
|---|---|
| MFE plain structure drawing | [ EPS | PDF | IMAGE CONVERTER | VIEW IN FORNA ] |
| Centroid plain structure drawing | [ EPS | PDF | IMAGE CONVERTER | VIEW IN FORNA ] |
| MFE structure drawing encoding base-pair probabilities | [ EPS | PDF | IMAGE CONVERTER | VIEW IN FORNA ] |
| Centroid structure drawing encoding base-pair probabilities | [ EPS | PDF | IMAGE CONVERTER | VIEW IN FORNA ] |
| MFE structure drawing encoding positional entropy | [ EPS | PDF | IMAGE CONVERTER | VIEW IN FORNA ] |
| Centroid structure drawing encoding positional entropy | [ EPS | PDF | IMAGE CONVERTER | VIEW IN FORNA ] |
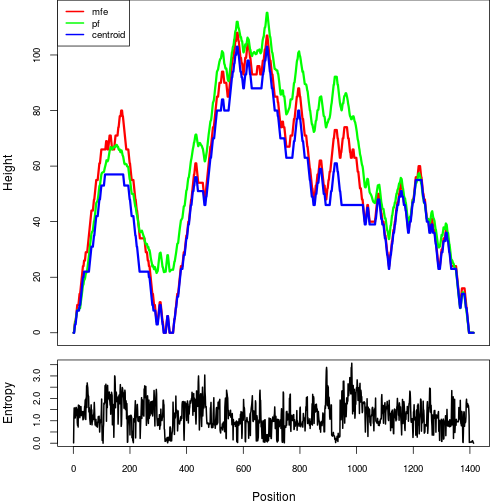
Here you find a mountain plot representation of the MFE structure, the thermodynamic ensemble of RNA structures, and the centroid structure. Additionally we present the positional entropy for each position. Download as [EPS|PDF|IMAGE CONVERTER].
Results have been computed using RNAfold 2.5.1. An equivalent command line call would have been
RNAfold -p -d2 --noLP < sequence1.fa > sequence1.out
RNA parameters are described in
Mathews DH, Disney MD, Childs JL, Schroeder SJ, Zuker M, Turner DH. (2004) Incorporating chemical modification constraints into a dynamic programming algorithm for prediction of RNA secondary structure. Proc Natl Acad Sci U S A 101(19):7287-92.
If you find these results helpful for your work you may want to cite:

|
Gruber AR, Lorenz R, Bernhart SH, Neuböck R, Hofacker IL. The Vienna RNA Websuite. Nucleic Acids Research, Volume 36, Issue suppl_2, 1 July 2008, Pages W70-W74, DOI: 10.1093/nar/gkn188 |
Lorenz, R. and Bernhart, S.H. and Höner zu Siederdissen, C. and Tafer, H. and Flamm, C. and Stadler, P.F. and Hofacker, I.L. "ViennaRNA Package 2.0", Algorithms for Molecular Biology, 6:1 page(s): 26, 2011