


RNA Secondary Structure Visualization Using a Force Directed Graph Layout

Overview
The forna package provides a web interface for displaying RNA secondary
structures using the force-directed graph
layout provided by the
d3.js visualization library.
The front end makes use of Bootstrap and
Knockout.js for the user interfact while the back end
uses Flask to serve the static files and provide a
REST API. The RNA structure manipulation and graph construction is created
using the python forgi RNA
structure manipulation library and the provided forna.py script. We heavily
depend on the python bindings of the ViennaRNA package.
Usage
Click on Add Molecule to draw a new secondary structure. The input should
contain a sequence and a secondary structure in dot-bracket notation:
GCUUCAUAUAAUCCUAAUGAUAUGGUUUGGGAGUUUCUACCAAGAGCCUUAAACUCUUGAUUAUGAAGUG
((((((((((..((((((.........))))))......).((((((.......))))))..)))))))))
You can also use the FASTA format to add multiple molecule at once. If you do not enter a structure, it will calculate the MFE structure at 37°C for you.
In the FASTA header you can specify a name and optionally also the number of the first or last nucleotide:
>name|start=5|end=60Zooming can be accomplished using the mouse wheel. Dragging the canvas leads to panning.
Colors
Position
Color the nucleotides according to their position in the molecule. Lower numbered nucleotides are closer to the 5' end and are colored green. Nucleotides in the middle are colored yellow whereas nucleotides near the 3' end are colored red.
Structure
Color the nucleotides according to the type of structure that they are in:
Green: Stems (canonical helices)
Red: Multiloops (junctions)
Yellow: Interior Loops
Blue: Hairpin loops
Orange: 5' and 3' unpaired region
Sequence
Color according to the nucleotide types:
Yellow: Adenine
Green: Cytosine
Blue: Uridine
Red: Guanine
Custom
Create a custom coloring scheme. The colors for each nucleotide or sets of nucleotide are specified in the text box that appears when the 'set' button is clicked. The format is simple. Numbers entered interpolated to colors and mapped to the respective nucleotides (the first number colors the first nucleotide, the second the second, etc...).
0.5 0.6 10 13.4
This will color the first four nucleotides such that the first two are lightly colored and the last two are more darkly colored.
The scale is interpolated between the lowest and highest value. We currently only use the white-blue color scale, but this will
be expanded shortly.
Coloring specific nucleotides is possible using the following format:
8:red 10:blue 11:greenThese directives will color the 8th nucleotide red, the 10th blue and the 11th green. Ranges of colors can also be entered:
1-10:green 15-30:red 13,46,101:blue
This will color nucleotides 1-10 green and nucleotides 15-30 red and 13,46, and 101 blue.
Colors can be specified for each molecule individually by preceding them with the molecule's id
        >molecule1
        1-10:green 15-30:red  13,46,101:blue
        >molecule2
        0.98 .80 0.75
Color ranges and domains
The default color range is white to steelblue. Custom ranges can be specified by entering the following in the custom color screen.
        >molecule1
        1-10:green 15-30:red  13,46,101:blue
        >molecule2
        range=white:red
        0.98 .80 0.75
Color domains can be specified in a similar manner. The domain defines the values
over which the colors are spread:
        domain=0.5:1.0
        0.98 .80 0.75
Pseudoknots
Feel free to enter structures with pseudoknots. Here's the format:
        >1GID
        AACCGG
        ((.[[.)).]]
Use your imagination!
Editing the Structure
Links can artificially be added by holding down the shift key and dragging from one nucleotide to another. This will form a spring-loaded bond between two nucleotides. This is useful for drawing interacting pairs of structures. Bonds can be deleted by holding down the shift key and clicking on a bond.Centering the view
The view can be centered on molecules being displayed by pressing the 'c' key or by clicking on the crosshairs button in the lower left hand corner.Force
The force can be turned off by either hitting the space key or by flipping the switch in the lower left hand corner of the screen.Friction / Wobbliness
How 'wobbly' a molecule appears can be adjusted by the friction slider in the settings menu just to the right of the colors menu. Lowering the friction (paradoxically) makes the molecule less wobbly and increasing it makes it more so.Exterior loop layout
Exterior loops can be drawn in a circular fashion: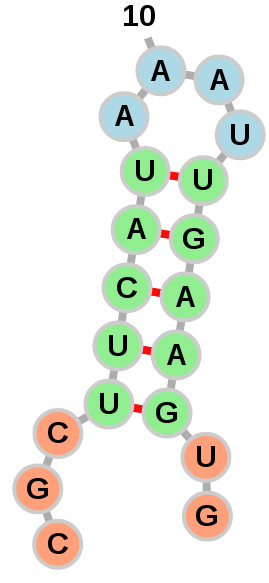 Or left to float around:
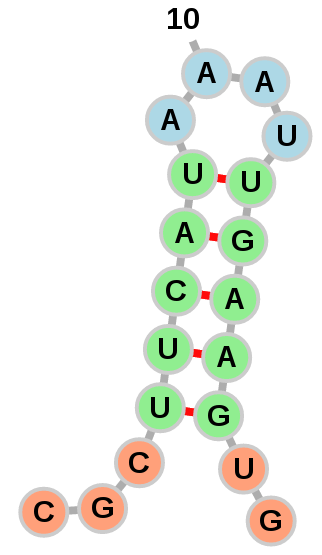 The option of which layout to use is left to the user with the
"Circularize exterior loops" option in the "Add RNA Molecule" dialog.
The option of which layout to use is left to the user with the
"Circularize exterior loops" option in the "Add RNA Molecule" dialog.
PDB Files
Secondary structure can automatically be extracted from PDB files and displayed. Simply click on the dropdown arrow next to 'Add Molecule' and select 'Add PDB File'. This will import every RNA chain in the PDB file and display its secondary structure. Proteins will be added as nodes with a size proportional to their length. Interactions between separate protein and nucleotide chains are displayed as dashed lines. The secondary structure is extracted using MC-Annotate [1].Citation
If you made use of forna in your scientific work, we would really appreciate a citation:
Kerpedjiev P, Hammer S, Hofacker IL (2015). Forna (force-directed RNA): Simple and effective online RNA secondary structure diagrams. Bioinformatics 31(20):3377-9.
Contact
Questions and/or comments can be sent to forna@tbi.univie.ac.at
Acknowledgement
This work was funded by the Austrian DK RNA program FG748004, by the Austrian FWF, project "SFB F43 RNA regulation of the transcriptome," and the European Commission under the Environment Theme of the 7th Framework Program for Research and Technological Development (Grant agreement no: 323987).